From Data to Action: Building Safety KPIs That Drive Real Change
By Derek Jennings, President, SEA
Most safety programs don’t struggle because they lack data—they struggle because they’re measuring the wrong things.
If your organization is tracking dozens of metrics but still seeing incidents, low engagement, or recurring risks, the problem isn’t effort—it’s focus.
What you measure drives behavior. And if you’re not intentional, it can drive the wrong behavior.
The Problem with Measuring Too Much
It’s easy to fall into the trap of tracking everything—TRIR, DART, training completion, inspections, audits, near misses, and more.
But more data doesn’t equal better safety. In fact, too many metrics often create confusion instead of clarity.
Effective safety programs focus on a small number of meaningful KPIs that align directly with business objectives. When everything is a priority, nothing is.
When KPIs Backfire: The Hidden Risk
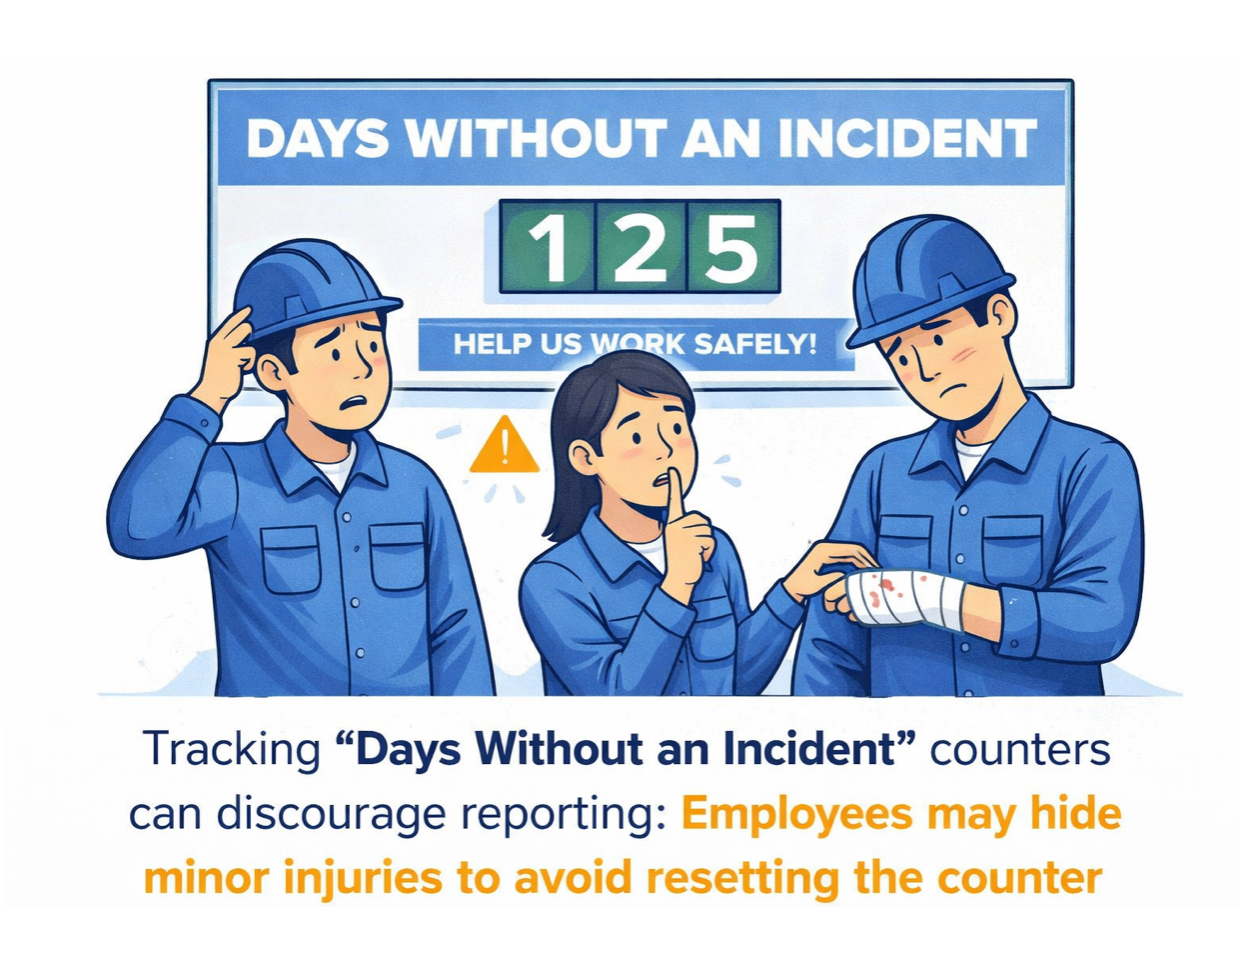
Not all safety metrics improve performance. Some can unintentionally make things worse.
Take “days without an incident” as an example. While it appears positive, it can discourage reporting. Employees may choose not to report minor injuries to avoid resetting the counter.
This creates a dangerous environment where issues are hidden instead of addressed.
The takeaway is simple: If your KPI discourages transparency, it’s working against you.
Start with Objectives—Not Metrics
Before selecting KPIs, organizations need to clearly define what they are trying to achieve.
Common safety objectives include:
- Reducing serious injuries or lost-time incidents
- Increasing employee participation and reporting
- Improving training compliance
- Enhancing leadership visibility
- Reducing regulatory exposure
Once the objective is clear, the right metrics become much easier to identify.
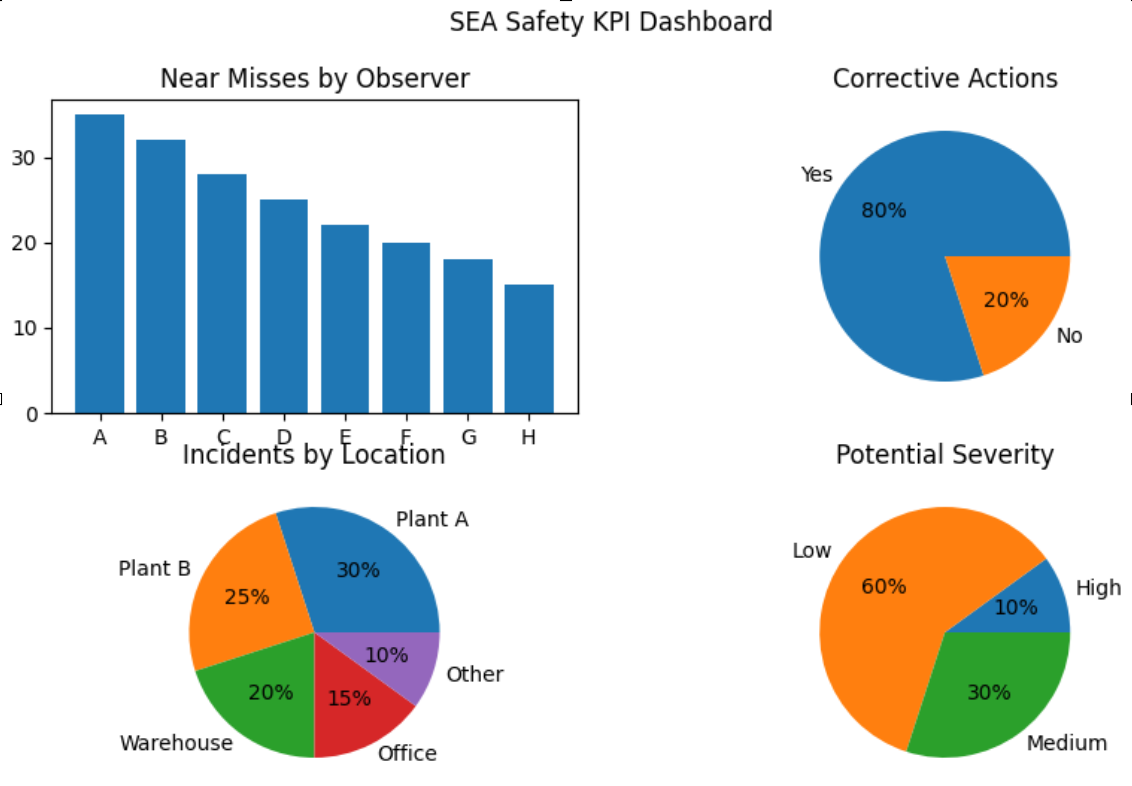
Balancing Leading and Lagging Indicators
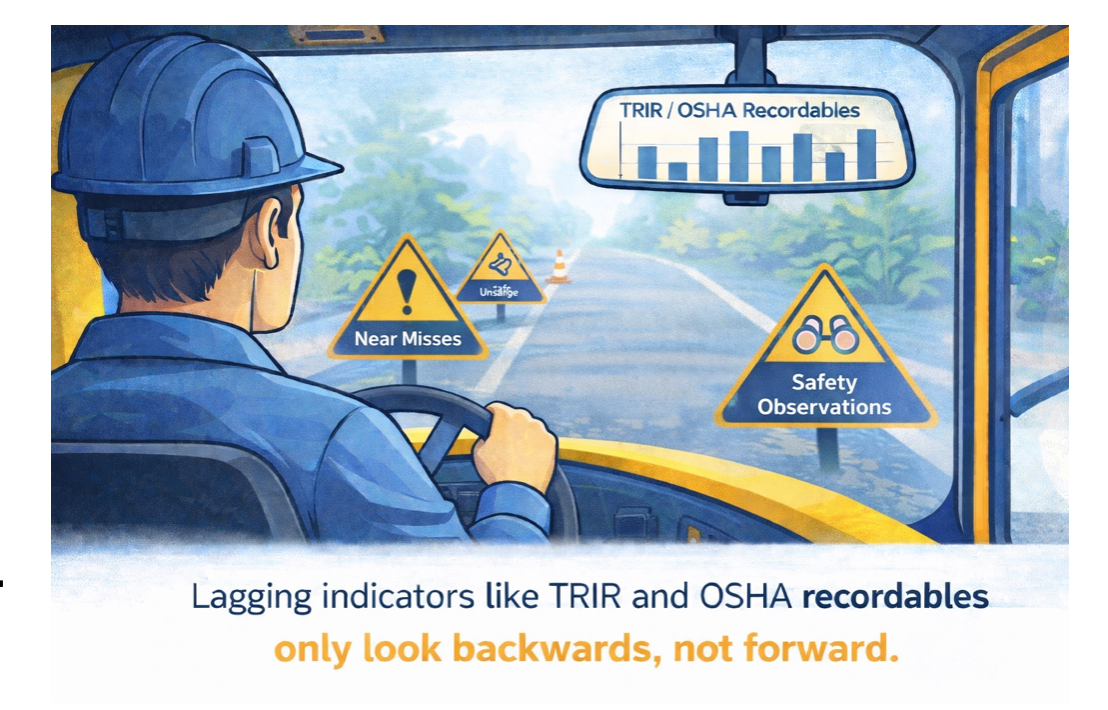
Many organizations rely heavily on lagging indicators such as TRIR and OSHA recordables. These metrics are important—but they only tell you what has already happened.
Leading indicators, on the other hand, provide insight into what could happen.
Examples include:
- Near-miss reporting
- Safety observations
- Corrective action completion
- Employee engagement in safety activities
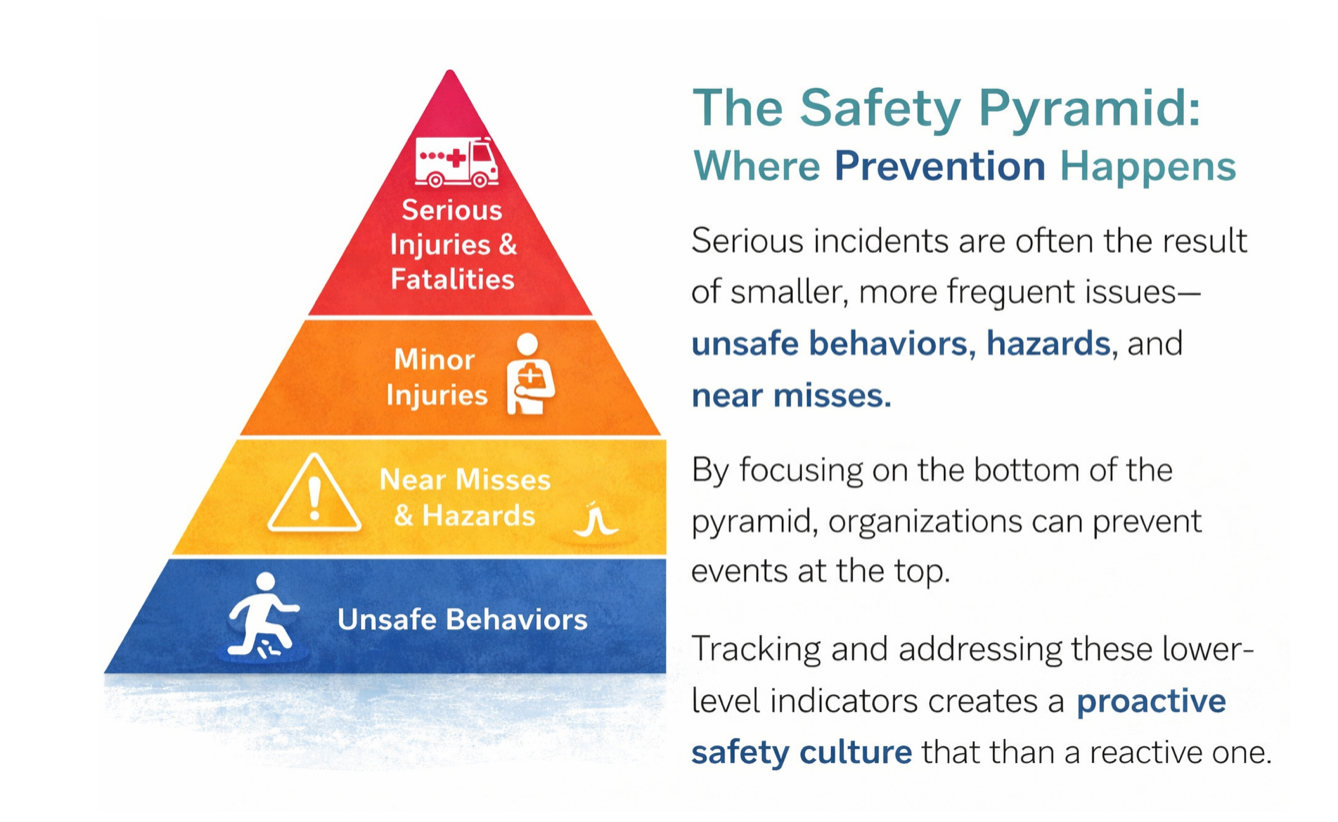
A strong safety program uses both. Lagging indicators measure outcomes, while leading indicators help prevent them.
The Safety Pyramid: Where Prevention Happens
Building Better KPIs with the SMART Framework
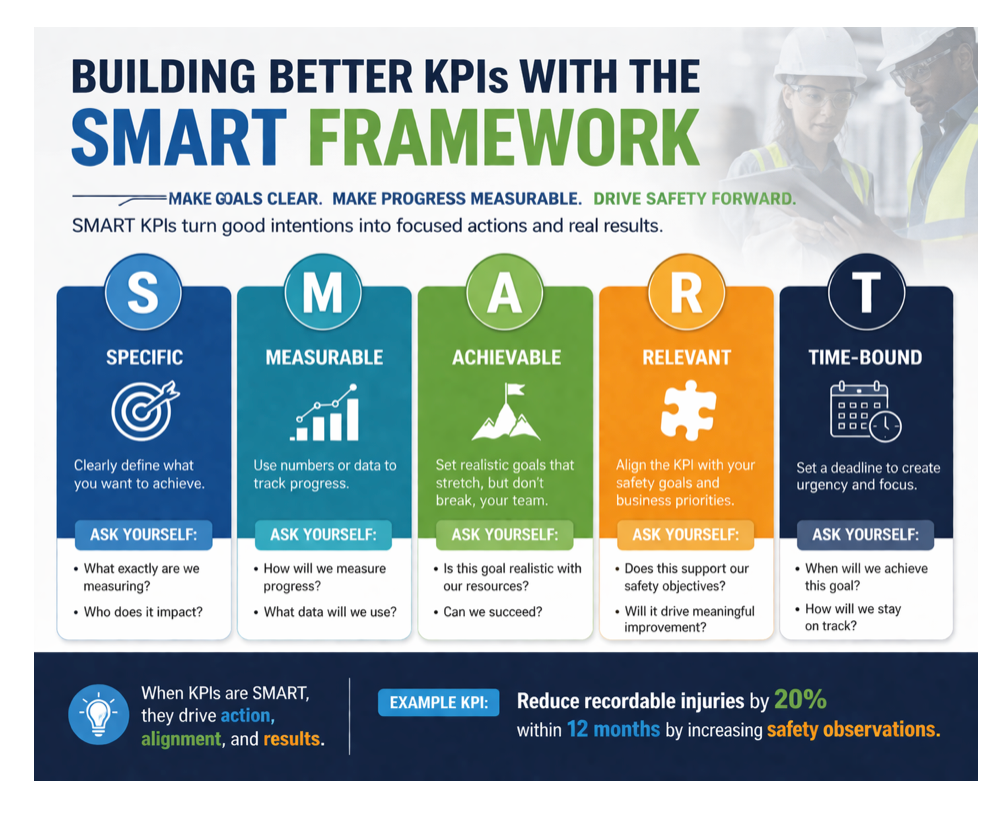
Effective KPIs follow the SMART framework:
- Specific – Clearly defined and understood
- Measurable – Trackable and data-driven
- Achievable – Realistic based on current performance
- Relevant – Connected to organizational goals
- Time-Based – Measured over a defined period
If a KPI doesn’t meet these criteria, it’s unlikely to drive meaningful improvement.
Turning Data Into Action
Data alone doesn’t improve safety—action does.
Organizations that see results are those that:
- Limit their KPIs to what truly matters
- Identify and close data gaps
- Engage employees in reporting and participation
- Act on trends and share insights across the organization
The goal isn’t to collect more data—it’s to use it effectively.
How SEA can Help
At SEA, we help organizations move beyond simply tracking metrics to building safety programs that drive real results.
Our team works alongside your organization to:
- Evaluate your current safety metrics
- Develop meaningful, actionable KPIs
- Improve leading indicator programs
- Enhance employee engagement
- Provide training and leadership support
- Support continuous improvement
Whether you’re building a safety program from the ground up or refining an existing one, SEA provides the expertise and support needed to create a safer, more effective workplace.